How i made a basic trading bot for stock and crypto
Posted on 2025-03-15 18:51:57
There are two fundamental problems with people. The biggest one is that they sleep. When we are sleeping, we are not making money, and as Warren Buffett probably said, "If you are not earning money while you're sleeping, then you will never be drinking rum on a yacht the size of Abu Dhabi's." I like rum, so it’s time to write some code to automate the trading of crypto and stocks so I’m still earning while drinking. SPOILER ALERT: by the end of this project, I managed to achieve a return on investment of 65.2%.
I know nothing about day trading or trading strategies, and I can only just read a candlestick graph. I am planning to try a few algorithms and see what works best, starting with a strategy called the Simple Moving Average (SMA) Crossover Strategy. To begin, there are two terms you need to know:
Short-term moving average (SMA): 7-day period
A 7-day SMA means you calculate the average price over the last 7 days. Every day, we remove the oldest value and add the newest value.
Long-term moving average (LMA): x-day period
The LMA is quite similar to the SMA, but it takes a longer-term average (over x days). It reacts more slowly to price changes because it considers more historical data. The LMA helps us filter out the noise caused by one-day anomalies.
So, the strategy is simple: let’s say the SMA is 100 and the LMA is 70—then we send a buy command. If the LMA is the larger number, we send a sell command. The cool thing about this strategy is that it works for both stocks and crypto.
The first step is fetching the data. This should be the easiest step, right? Oh, how wrong I was. I decided to use Coinbase as my crypto exchange. I created my API key, added it to my .env file, and—BAM—401 error. I spent about three hours battling the Coinbase API and its documentation. I finally had a realisation while walking to the pub: other crypto exchanges exist. So, I made an account with Binance, clicked "Verify," and—oh, it turns out Binance is banned in the UK. Next stop: Kraken. And, would you believe it? Their API just works. (Side note: Kraken supports Monero—win for privacy coins.)
Another side note: if you work for any of these companies (or any other company) and have some company swag, shoot me an email.
Now, future me decided to come back and test the algorithms for stocks as well. I ended up using the Alpha Vantage API. It was as easy as changing the API endpoints. They had almost the same headers, so there weren’t many changes needed to get this working for stock prediction.
Now that we have the data, it’s time to get back to coding. (I write while coding, so at this point, you know as much as I do—or more, if you’ve jumped to the results page.)
The Kraken API allows you to request data at specific intervals over a certain number of days. For example, you can request data for every hour over the last 25 days. However, you can’t just make up the intervals. In minutes, the options are:
1, 5, 15, 30, 60 (1 hour), 240 (4 hours), 1440 (1 day), 10080 (1 week), or 21600 (2 weeks).
Once we’ve made the API call and have the price for every hour over 25 days, I then need to put the data into an easy-to-use format. The API returns the data in JSON format, so I’m going to turn it into a dataframe. A dataframe is a two-dimensional tabular data structure—basically, think of it as a spreadsheet. It has rows and columns, with a column name and an index to locate each row. Here’s the neat bit of code to do that:
def  CreateDF(data):

df = pd.DataFrame(data, columns=["Time", "Open", "High", "Low", "Close"])

# Convert the timestamp to datetime

df["Time"] = pd.to_datetime(df["Time"], unit='s')

df.set_index("Time", inplace=True)

# Convert price columns to floats

df["Open"] = df["Open"].astype(float)

df["High"] = df["High"].astype(float)

df["Low"] = df["Low"].astype(float)

df["Close"] = df["Close"].astype(float)

return df
Now, it’s time to calculate our moving averages. Luckily, this is only two lines of code:
def  calculate_sma(df, window):

return df['Close'].rolling(window=window).mean()
short_momentum = calculate_sma(dataframe, short_term_window)
long_momentum = calculate_sma(dataframe, long_term_window)
Its the time you all been waiting for. GRAPH TIME!
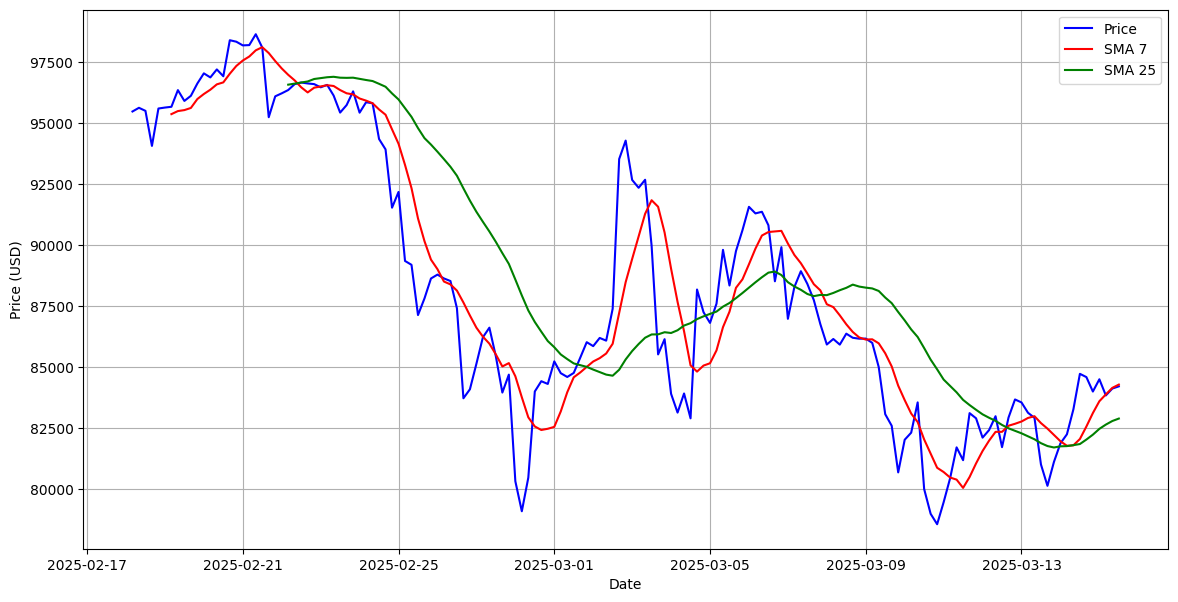
Buy Signal → When the short-term moving average (SMA 7 in red) crosses above the long-term moving average (SMA 25 in green).
Sell Signal → When the short-term moving average (SMA 7 in red) crosses below the long-term moving average (SMA 25 in green).
Now, it’s time to simulate how much we would earn if we started with $100.
initial_balance = 100  # Starting balance in USD

btc_balance = 0

position = False

buy_price = 0

trade_log = []
Now, we run through the simulation function. We loop through every hour from the start to the length of the dataframe. Next, we check for a buy signal:
short_momentum.iloc[i] > long_momentum.iloc[i] and short_momentum.iloc[i - 1] <= long_momentum.iloc[i - 1]
Next, we check if we currently have a position (i.e., if we own any Bitcoin).
Then, we check if the long-term moving average crosses above the short-term moving average:
short_momentum.iloc[i] < long_momentum.iloc[i] and short_momentum.iloc[i - 1] >= long_momentum.iloc[i - 1]
If we own Bitcoin, we create a sell request. When we run out of data in the trading loop, all remaining crypto gets sold off.
Here’s the output:
BUY at 85859.90 on 2025-03-02

SELL at 83918.20 on 2025-03-04

BUY at 89757.10 on 2025-03-05

SELL at 85926.00 on 2025-03-08

BUY at 82929.90 on 2025-03-12

SELL at 83271.00 on 2025-03-14

BUY at 84724.20 on 2025-03-14

FINAL SELL at 84223.30 on 2025-03-15
Here is the trading graph going of this data.
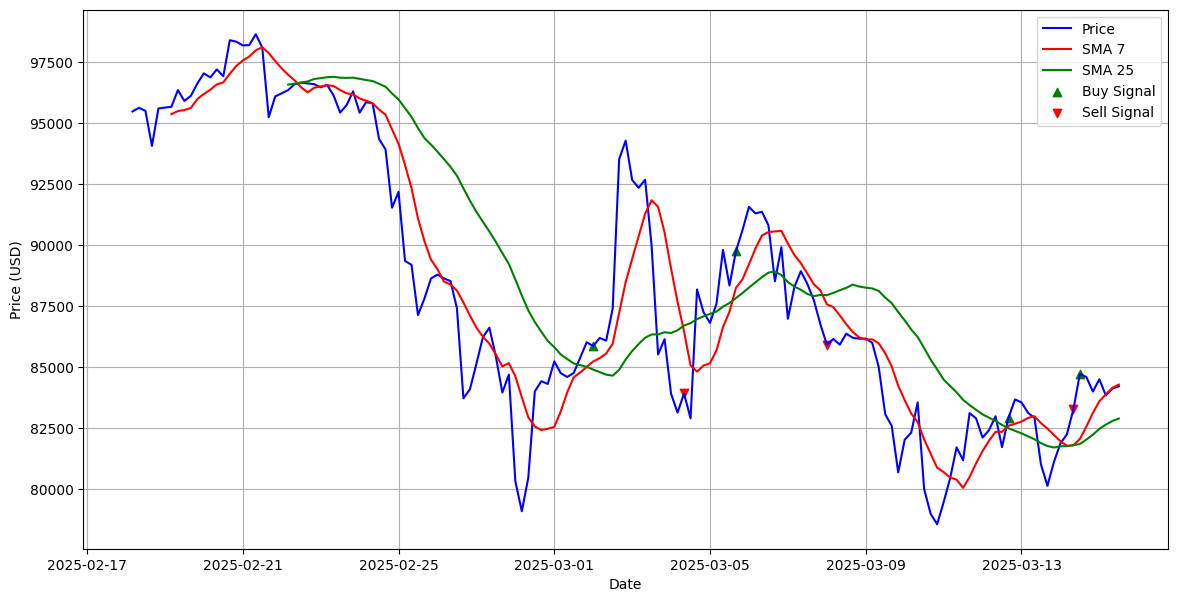
So the stats with an initial balance of $100.00 we made 8 trades coming to a final balance of $93.40. This leads to an ROI (return on investment) of -6.60%. I’ll be honest—I was hoping for a positive ROI, but this is only a basic strategy. However, if I switch this from Bitcoin to MSFT (Microsoft stock), I get this graph:
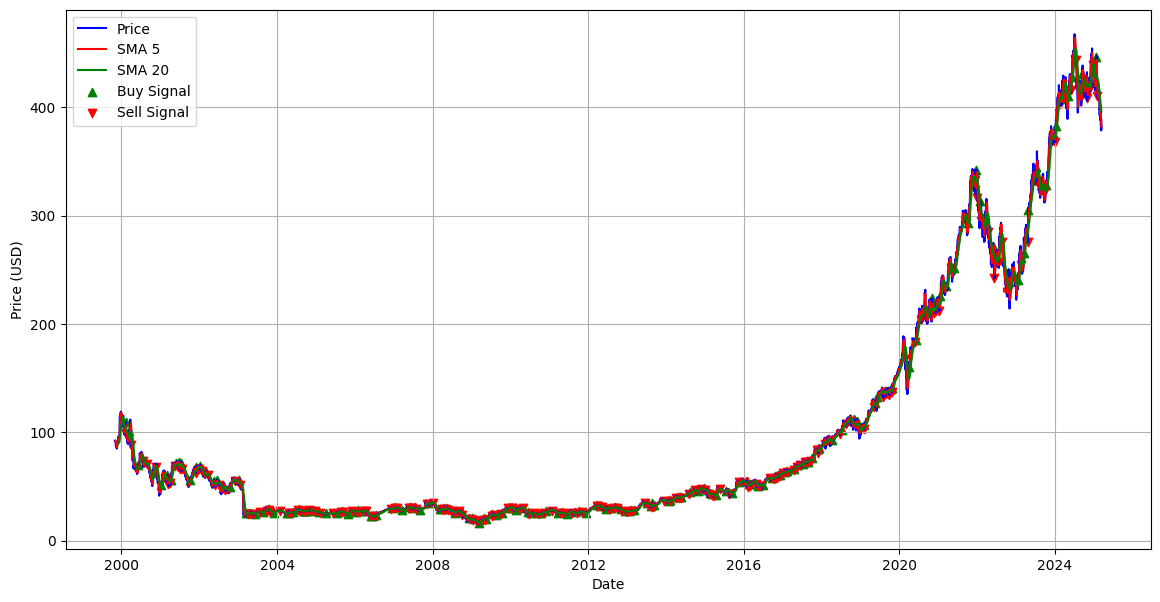
This leads to a final balance of $139.53, which is an ROI of 39.53%. That is an impressive result and more in line with what I was hoping for. There’s no difference in the code when switching from crypto to stocks, so I thought I’d just include the final graph. It was kind of a spur-of-the-moment thing. Links to the code will be at the end.
We can improve this by using a few systems, such as:
-
Exponential Moving Average (EMA) Crossover,
-
MACD (Moving Average Convergence Divergence), and
-
RSI (Relative Strength Index) Strategy (this one may be covered in another post).
The Exponential Moving Average (EMA) Crossover is a type of strategy that gives more weight to recent prices, making it react faster to price movements compared to the Simple Moving Average (SMA). With EMA, we apply a weighting that makes the most recent values have a greater impact than the older values.
Where:
- \( EMA_t \) = Current EMA

- \( P_t \) = Current price

- \( EMA_{t-1} \) = Previous EMA

- \( \alpha \) = smoothing function

- \( N \) = Number of periods (window size)
If you don't get the maths don't worry about it. Here is a small table to show off how the EMA works. (I got the formular of wikipedia :@ :| )
Price EMA

0 10 10.000000

1 20 15.000000

2 30 22.500000

3 40 31.250000

4 50 40.625000

5 60 50.312500

6 70 60.156250
The graphs for the EMA is pretty much the the same the only differnce is where the sell and by points are on graph.
Well, this did not go according to plan. I ended up with a final balance of $91.03, which is an ROI of -8.97% when using Bitcoin. Before we consider this a write-off strategy, let's take another look at Microsoft stocks. With this new system, we end up with a final balance of $160.40, so that's an ROI of 60.40%. While this new algorithm is worse for crypto, we see a massive improvement when it comes to traditional stocks.
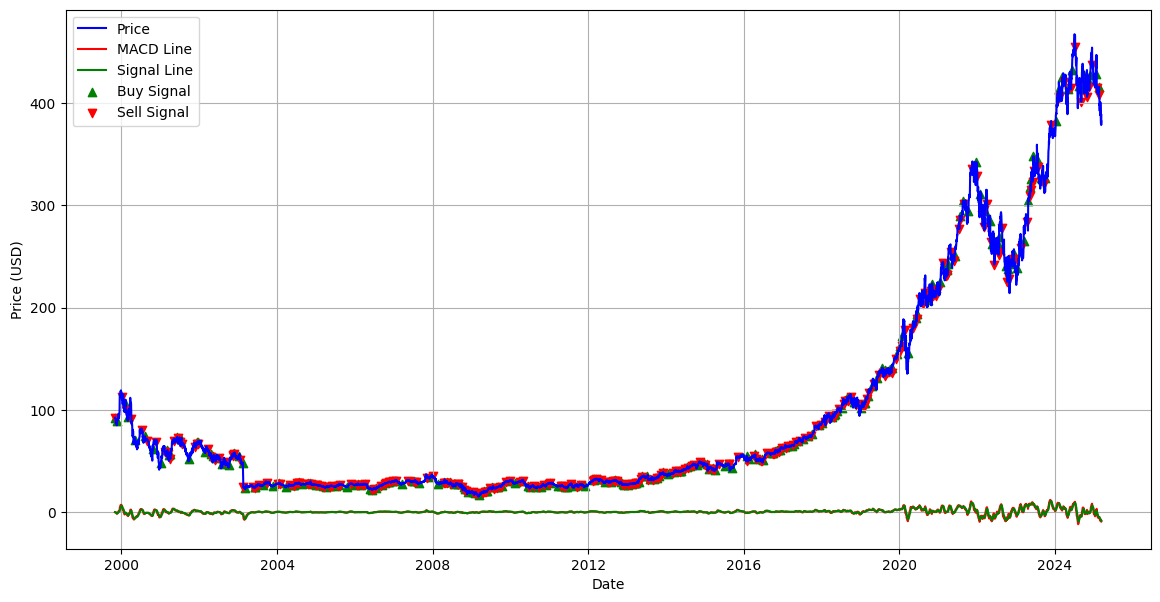
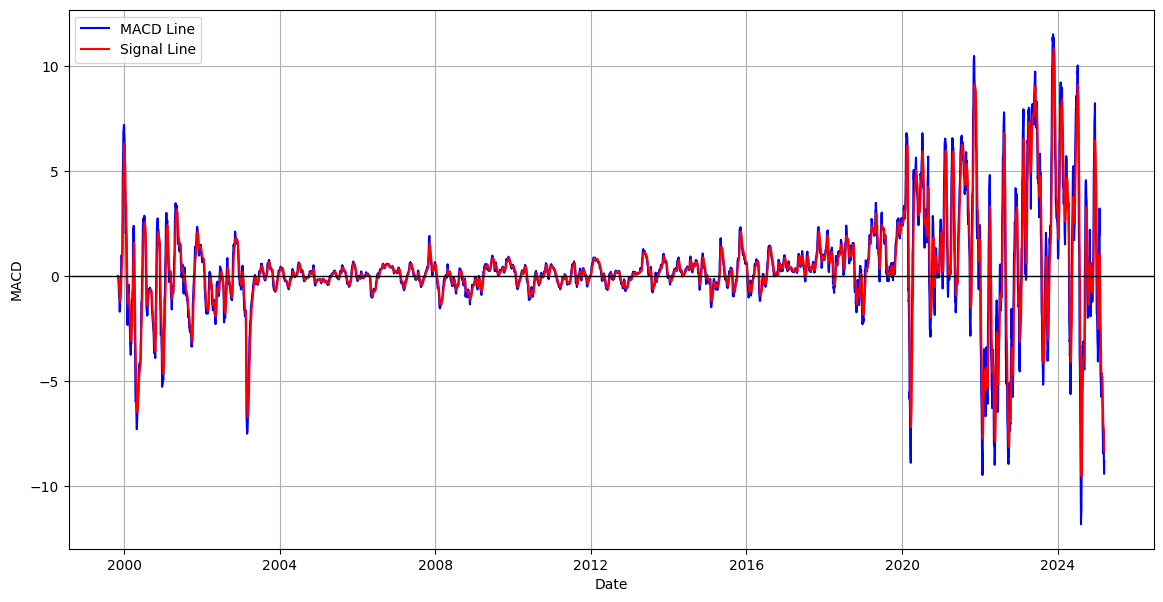
I think we can still make this better, let’s give MACD (Moving Average Convergence Divergence) a go. MACD shows the relationship between two Exponential Moving Averages. It uses two lines: the MACD line, which measures the difference between the short and long-term averages, and the Signal line, which is a smoothed version of the Exponential Moving Average. We look for a BUY signal when the MACD crosses above the Signal Line, and a SELL signal is triggered when the MACD crosses below the Signal Line.
Here is a graph of this.
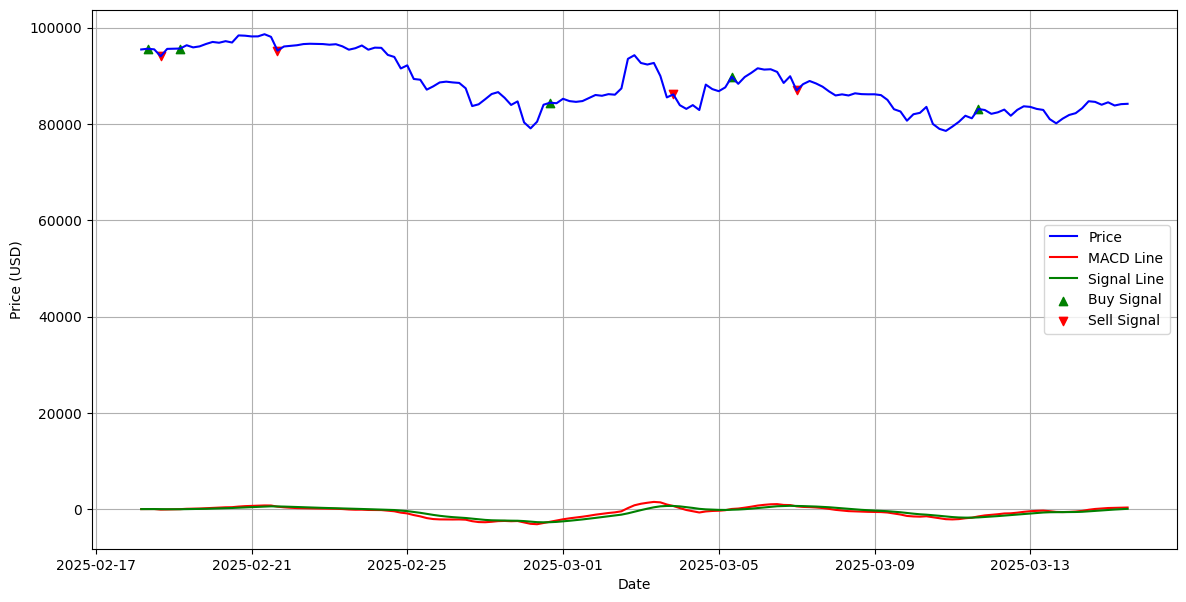
its a bit hard to see whats going on with the MACD and the Signal lines here. So lets ZOOM AND ENHANCE.
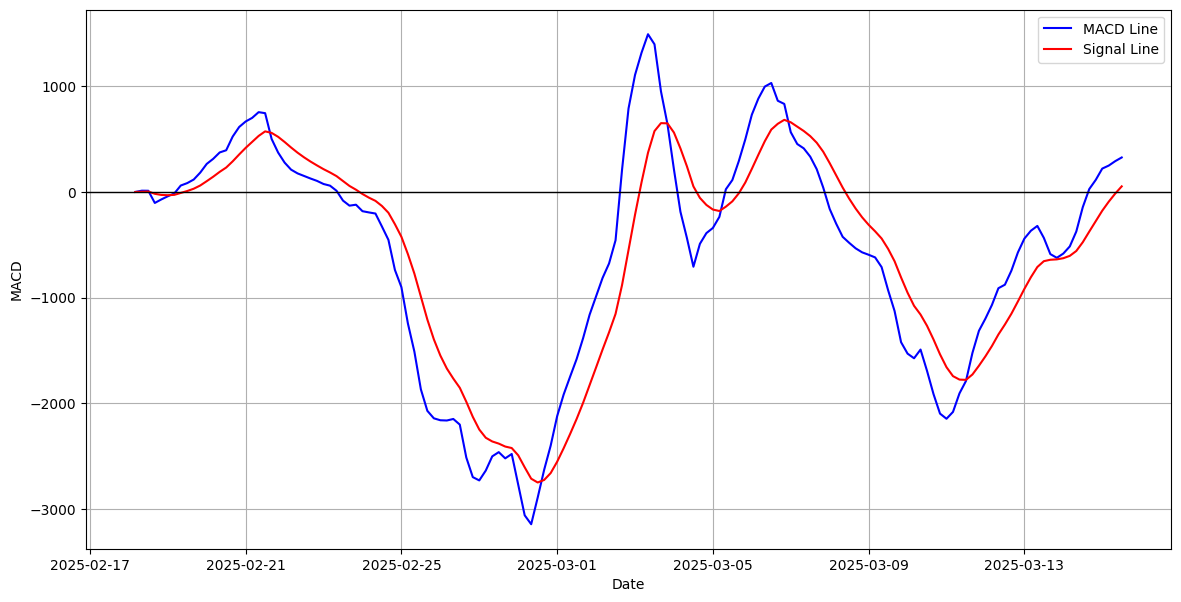
So, this leads to a final balance of $98.03, which results in an ROI of -1.97%. While this is still not a profit, it is the smallest crypto loss yet. So, let’s take a look at that Microsoft stock.
ZOOM AND ENHANCE
You can see the lines fluctuating over each other a lot more. This means there are far more buy and sell signals compared to any other algorithm. So, does more trading mean more profit? INSERT DRUM ROLL The final balance with the Microsoft stock is $165.21, which gives an ROI of 65.21%. This is an incredible result. I’m going to do some more fine-tuning and then possibly set it up for live trading. If that happens, there will be another post. Please note, this does not take into account transaction fees. Once they are included, I’m sure the profit would be lower.
So, why do these algorithms work better with traditional stocks than with crypto?
These are more educated guesses now, as I’m a computer science student with little knowledge of how the finance sector really works. Crypto is much more volatile and can be heavily influenced by something as simple as a tweet. Some cryptocurrencies can change by 10% or even 20% in a matter of hours, making them nearly impossible to predict. The stock market, on the other hand, has something called Limit Up-Limit Down (LULD), which (in theory) prevents extreme volatility, leading to more predictable patterns. Moving averages and momentum indicators don’t reset daily with crypto because it operates 24/7, which makes it even harder to establish reliable patterns. The stock market has clear opening and closing hours, which helps small patterns to form. I’m sure there are many other reasons, but I’ll leave it to the financial experts on Reddit to explain those.
If you enjoyed the blog, feel free to join Discord or Reddit to get updates and discuss the articles, or follow the RSS feed. If you feel like supporting me feel free to donate a cuppa using the buy me a coffee link in the corner. If you're a company feel free to send me some swag, I will be looking for placements soon.